
Variables representation
plotVar(result, pch = 20)
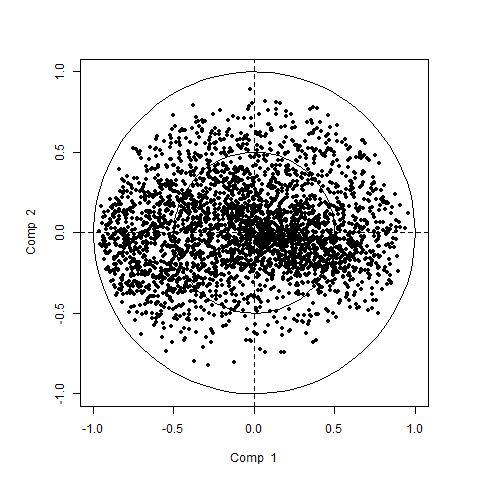
The use of a sparse IPCA would be more appropriate to interpret the results.
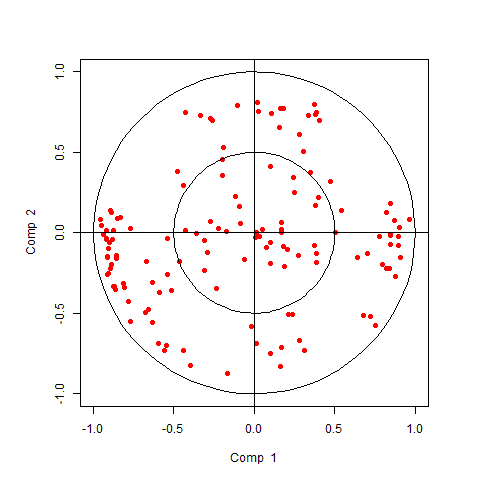
Sparse IPCA analysis
sparse IPCA directly implements soft-thresholding on the independent loading vectors, similar to the sPCA implemented mixOmics.
sipca.result <- sipca(X, ncomp = 3, mode = "deflation",
                         scale = FALSE, keepX = c(50,50,50))

sipca.result$kurtosis
[1] 10.6698119   7.215954   0.5875141

## plot variables
plotVar(sipca.result)
R_script:
References
- Yao F., Coquery J., Lê Cao K.-A. (2012) Independent Principal Component Analysis for biologically meaningful dimension reduction of large biological data sets, BMC Bioinformatics 13:24. [link]
Pages: 1 2