
sPLS-DA analysis for 1 factor
We arbitrarily selected 200 variables per dimension, but a more objective tuning would involve using the tune.multilevel.R function (here).
data(data.simu)
X.simu <- data.simu$X
stimulation <- data.simu$stimu
repeat.simu <- data.simu$sample
result.1level <- multilevel(X.simu,
cond = stimulation,
sample = repeat.simu,
ncomp = 3,
keepX = c(200,200,200),
tab.prob.gene = NULL,
method = 'splsda')
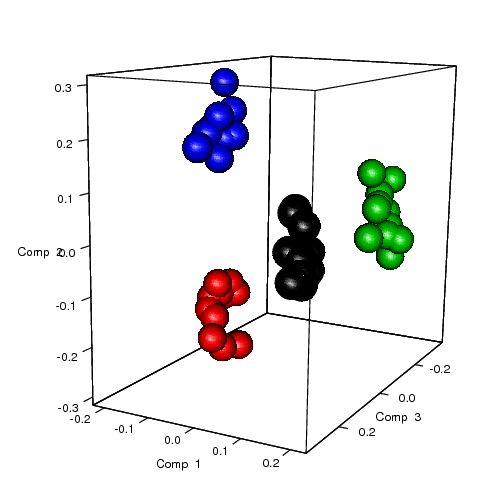
# sample representation
plot3dIndiv(result.1level, col = as.numeric(data.simu$stimu), cex = 10);
The 3D plots for samples:
pheatmap.multilevel(result.1level,
                   col_sample=col.sample,
                   col_stimulation=col.stimu,
                   label_annotation=NULL,
                   border=FALSE,
                   clustering_method="ward",
                   show_colnames = FALSE,
                   show_rownames = TRUE,
                   fontsize_row=2)
The pheatmap.multilevel function generates the following chart:
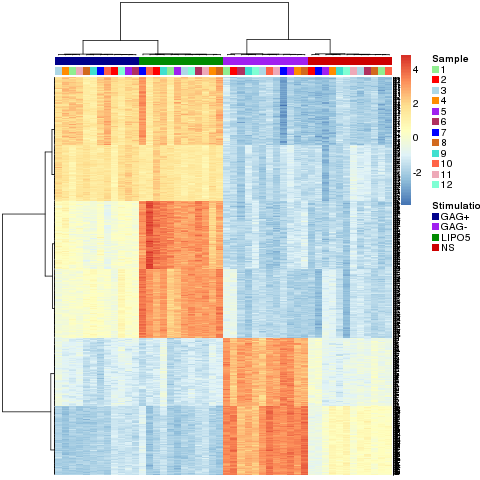
In this chart, the genes are displayed in rows and the sample in columns. The class of each sample is labelled at the top.