
sPLS analysis
Warning: The liver toxicity study does not apply for a multilevel analysis as the rats were killed at different time points. The given example serves as an illustration, where we made the wrong assumption that measurements were repeated on the same rats for the same time point.
The conditions are the different doses of acetaminophen.
See sPLS:Liver Toxicity for an overview of the liver toxicity dataset.
data(liver.toxicity)
X.rat = as.matrix(liver.toxicity$gene)
Y.rat = as.matrix(liver.toxicity$clinic)

# artificially create the repeated measurements
repeat.indiv = c(1,2, 1,  2,  1,  2,  1,  2,  3,  3,  4,  3,  4,  3,  4,  4,  5,  6,  5,  5,  6,  5,  6,  7,  7,  8,  6,  7,  8,  7,  8,  8,  9, 10,  9, 10, 11, 9,  9, 10, 11, 12, 12, 10, 11, 12, 11, 12, 13, 14, 13, 14, 13, 14, 13, 14, 15, 16, 15, 16, 15, 16, 15, 16)
# one factor:
dose = liver.toxicity$treatment$Dose.Group
result.rat <- multilevel(X = X.rat,
Y=Y.rat,
cond = dose,
sample=repeat.indiv,
ncomp = 3,
keepX= c(50,50, 50),
keepY= c(10,10,10),
method = 'spls')
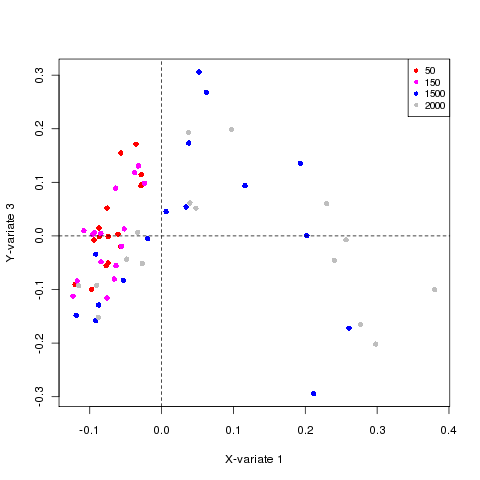
# sample plot
plotIndiv(result.rat,comp=c(1,3),rep.space="XY-variate",col = as.numeric(dose),
ind.names =FALSE, cex = 1, pch = 16)
legend("topright", col = unique(dose), legend = unique(dose), pch = 16, cex = 0.8);
Plotting the samples:
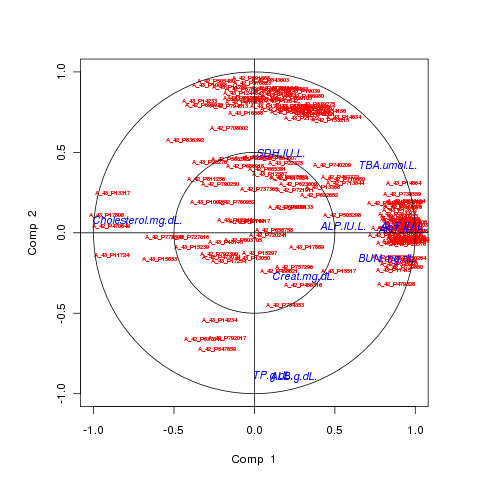
# variable plots
plotVar(result.rat, comp = 1:2, X.label = TRUE, Y.label = TRUE, cex = c(0.5,0.9))
Representation of the selected variables:
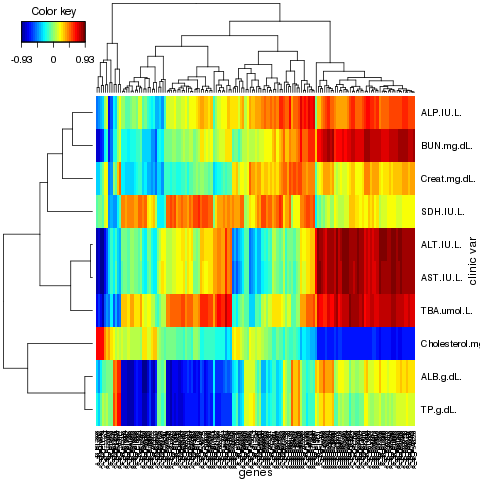
CIM <- cim(result.rat, comp = 1:3, xlab = "genes", ylab = "clinic var",
              margins = c(5,6), zoom = FALSE)
The clustered image maps:
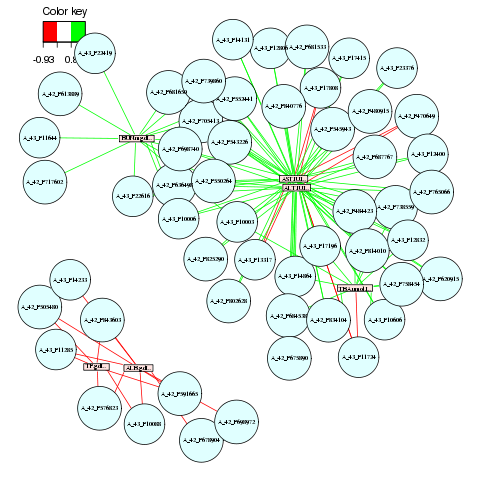
network(result.rat,
        comp = 1:3,
        threshold = 0.8,
        Y.names = NULL,
        keep.var = TRUE,
        color.node = c( "lightcyan","mistyrose"),
        shape.node = c("circle", "rectangle"),
        color.edge = c("red", "green"),
        lty.edge = c("solid", "solid"),
        lwd.edge = c(1, 1),
        show.edge.labels = FALSE,
        interactive = FALSE)
And the network:
References
Liquet, B., Lê Cao, K.-A., Hocini, H. and Thiebaut, R. A novel approach for biomarker selection and the integration of repeated measures experiments from two platforms. Submitted.
Westerhuis, J. A., van Velzen, E. J., Hoefsloot, H. C., and Smilde, A. K. (2010). Multivariate paired data analysis: multilevel PLSDA versus OPLSDA. Metabolomics, 6(1), 119-128.