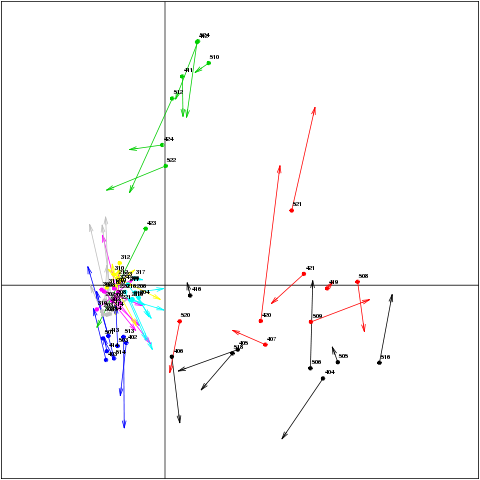
For an (s)PLS analysis (mode =’canonical’), the s.match() function displays the samples from both data sets in a superimposed manner. To each arrow corresponds one sample. The start of the arrow indicates the location of the sample in X in one plot, and the tip the location of the sample in Y in the other plot. Short arrows indicate if both data sets strongly agree and long arrows a disagreement between the two data sets. the latent variables (or ‘variates’) are given as an input from a (s)pls object.
Usage in mixOmics
data(liver.toxicity)
X <- liver.toxicity$gene;
Y <- liver.toxicity$clinic;
result <- spls(X, Y, mode = "canonical", ncomp = 3,
                  keepX = c(50,50,50), keepY = c(10,10,10));
colour <- as.numeric(liver.toxicity$treatment[,2]);
labels <- liver.toxicity$treatment[,1]
s.match(result$variates$X[, c(1,2)],
        result$variates$Y[, c(1,2)],
        clabel = 0.5,
        label = labels,
        col = colour);