
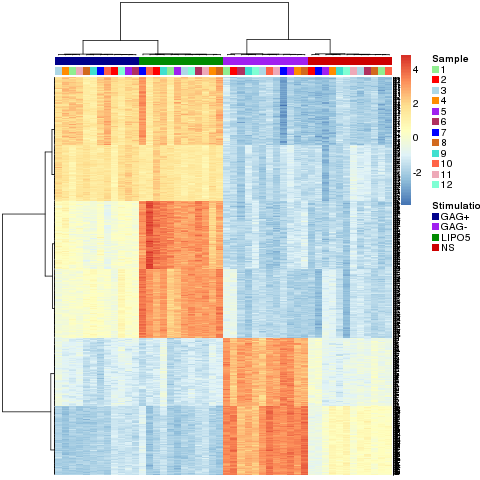
We use the package ‘pheatmap’ to represent a hierarchical clustering of the variables selected by the multilevel analysis (for method = ‘splsda’) as it can display the factor(s) cond.
Usage in mixOmics
data(data.simu);
X.simu <- data.simu$X
stimulation <- data.simu$stimu
repeat.simu <- data.simu$sample

result.1level <- multilevel(X.simu,
                         cond = stimulation,
                         sample = repeat.simu,
                         ncomp=3,
                         keepX=c(200,200,200),
                         tab.prob.gene=NULL,
                         method = 'splsda')

pheatmap.multilevel(result.1level, col_sample=col.sample, col_stimulation=col.stimu,
              label_annotation=NULL,border=FALSE,clustering_method="ward",
              show_colnames = FALSE,show_rownames = TRUE,fontsize_row=2)
See also Multilevel:Liver Toxicity case study for a two factors display.