Summary
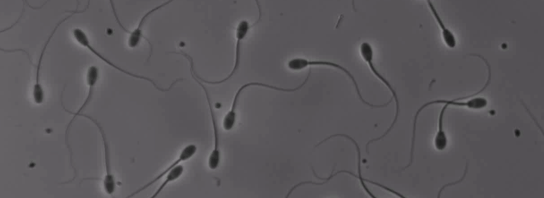
The project is about producing an automated assessment process of semen fertility, based on the massal motility as a fertility indicator. The visual observation of a drop of undiluted semen under a phase contrast microscope reveals the collective motion of millions of spermatozoa moving together in circular waves and whirlpools. This collective motion is referred to as massal motility, by contrast to the individual motility of single spermatozoa. The massal motility is the only parameter of semen which shows a good correlation with male fertility. Skilled operators are able to detect good or bad semen samples by the mere visual observation of these waves. Although highly subjective, this assessment has proved effective for the prediction of fertility in sheep species.
Objectives
The goal of the project is to design an automated semen fertility assessment, based on the observation and measurement of the semen massal motility. The process follows a sequence of data acquisition and processing:
1st phase: Data acquisition: Semen is obtained by collection of rams housed at the experimental unit of the PRC team. For each semen sample, a microscope video recording is acquired using several microscope acquisition techniques and a subjective score is assessed. The observation of the semen waves by contrast phase microscopy is the closest to the current manual assessment process. However, a new process, consisting of mixing fluorescent latex beads, has been implemented by the PRC team. The confocal observation of these beads may lead to a better reconstruction of the flow velocity. This phase should provide us with an unprecedented set of video recordings from the individual spermatozoon to the semen range. This set of data is the key to the calibration of the models.
2nd phase: Flow map reconstruction. From the semen video sequences, the semen flow will be reconstructed using OFR (for ‘Optical Flow Reconstruction’). The OFR technique allows for the use of models to improve the quality of the reconstruction. First, we propose to use an integrated version of the constant brightness hypothesis. Second, we propose new models to take illumination variations into account. The intensity and sharpness of the spermatozoon depends on their distance to the focal plane. Such knowledge can be used to estimate the vertical component of the motion field and model the 3D displacement vector field.
3rd phase: Scoring and learning phase: The scoring will be based on an observation of the reconstructed flow. A learning technique will be applied to transform the subjective assessment of the technicians into an automated score. The inputs of this learning task consist of a training set made of temporal sequences of velocity maps that have been scored by experts. The goal is to learn a classification rule from this training set so that future, unseen sequences of velocity maps can be scored automatically.
4th phase: Modeling and improvement of the OFR technique by models: macroscopic models will start to be developed to improve the OFR. We will find the best calibration of the model coefficients from the experimental data by adding control parameters to account for the model error. Once calibrated and numerically optimized (parallel implementation), the model will be used to provide a better reconstruction of the semen flow from the recorded image, in an iterative use of the calibration and flow reconstruction procedures.
Partners
| Partner | Project team | URL |
|---|---|---|
| Institut de Mathématiques de Toulouse (IMT – UMR 5219) | Degond Pierre | http://www.math.univ-toulouse.fr/ |
| Laboratoire d’Informatique, Signaux et Systèmes de Sophia-Antipolis (I3S – UMR 7271) | Blanc-Féraud Laure | http://www.i3s.unice.fr/I3S/ |
| Institut national de recherche agronomique (INRA – centres de Tours et Toulouse) | Druart Xavier | http://www.tours.inra.fr/ http://www.toulouse.inra.fr/ |
| Institut de Mécanique des Fluides de Toulouse (UMR 5502) | Plouraboué Franck | https://www.imft.fr/ |
| IMV Technologies | Schmitt Éric | http://www.imv-technologies.com/ |
Work Programme
The Work programme can be summarized as follows (the project management is WP0):
- WP1: Industrial specification & assessment (responsible IMV-Technologies) commands all other tasks of the project. By setting up the goals, it fixes the objectives to be reached by all the other WP. The performances of the scoring method (WP4), and consequently, of all the other WP are evaluated twice during the course of the project. A first mid-term evaluation collects the results of WP4 at T0+30 and returns an assessment of the project at T0+36 (see Gantt diagram, figure 3). Then, corrective measures can be developed until the end of the project. The last evaluation takes place at the end of the project and should decide whether the procedure is suitable in an industrial perspective.
- WP2: Experiments and data acquisition acquires video images through microscope observation. The task starts at T0 and lasts until T0+36, given the different acquisition techniques which are planned. This tasks delivers results to WP3: Image processing. If image processing is impossible due to the poor quality of the recordings, then a feedback to WP2 from WP3 is made. WP2 also provides phase contrast microscopy directly to WP4 as these images may be directly scored without flow reconstruction. A similar feedback from WP4 to WP2 is scheduled if poor image quality does not allow for convenient scoring.
- WP3: Image processing collects video images acquired by WP2 and processes them either through PIV technique or through OFR technique. This task starts at T0+6 as soon as the first images are available and lasts until the end of the project, since the constant improvement of the processing until the end (and particularly through models for OFR) will contribute to the good quality of the score. This tasks receives data from WP2 and delivers reconstructed flow to WP4. A feedback is scheduled from WP4 to WP3 in case of bad quality of flow reconstruction. Then corrective measures are taken in WP3 to improve the quality of the flow reconstruction. This task also delivers to WP5 for validation/calibration of the models. In return, this task receives from WP5 for the improvement of the OFR using models.
- WP4: Scoring and learning collects the reconstructed flow maps from WP3 and develops the scoring methodology through learning of the subjective scores. This task also involves the evaluation of the scores through actual AI with the scored samples. This task also collects directly phase contrast microscopy images from WP2 because the scoring of these images may be possible without flow reconstruction. This task delivers to WP1 for evaluation. It starts at T0+6 as soon as the first phase contrast microscopy images are available and lasts until the end of the project. Indeed, since the evaluation phase consists in observing the success of failure of actual AI’s it involves an incompressible time for gestation.
- WP5: Modeling: the modeling task receives reconstructed flows from WP3. It delivers a validated and calibrated model to WP3 for OFR improvement. It starts at T0 due to the complexity of modeling at both the micro and macro scale and the need for the establishment of a rigorous link. The calibration starts at T0+24 where it receives data from WP3. This relation to WP3 continues until the end, as new reconstructed flows are constantly produced. It delivers the model for OFR improvement to WP3 at T0+36. Since T0+36 on, calibration from WP3 and improvement of WP3 is implemented, in the spirit of data assimilation techniques in meteorology (notably Kalman filter techniques).